Wisconsin DNR Scientists Assess Trends Of PCBs In Lake Michigan Salmon
The Wisconsin Department of Natural Resources began tracking the levels of polychlorinated biphenyls (PCBs) in Lake Michigan salmon in 1975. That was two years before their use and manufacture was banned in the United States.
By continuing monitoring efforts from that point through 2010, scientists there had a robust dataset on the contaminant’s levels in chinook and coho salmon over a period of decades. But few had sat down and quantified trends over the time period.
Doing so was important for establishing a timeline of the changes brought on by the new regulations, which could be used as an indicator of success as well as rationale for other similar contaminant bans in the future. In addition, efforts to model trends of PCBs in Lake Michigan fish can be used in evaluating efforts to remediate ongoing sources of PCBs in Lake Michigan.
So, to meet those needs and satisfy a little curiosity, researchers at the DNR undertook an effort to analyze the data in 2014 and find the best linear models for evaluating the patterns within the set.
“We analyzed these data to estimate trends in PCB concentrations in these fish (1975–2010),” researchers write in an open-access study detailing the effort in the Journal of Great Lakes Research.
Most of the salmon in the dataset were gathered during fall migration periods at weirs using nets or electrofishing methods. Salmon were also sometimes collected from open water areas in gill nets used as part of fisheries assessments or through angler donation programs. Annual fish collections were common until 1990, scientists say, after which time they took place every other year.
After collection, fish were measured for length, labeled and then frozen before being sent to the Wisconsin State Laboratory of Hygiene. There, they were weighed and evaluated for things like gender and age. The fish were filleted, ground up and underwent lipid and PCB content analysis.

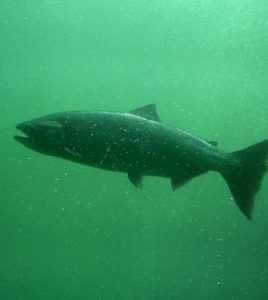
Chinook salmon. (Credit: Riccardo Rossi, via Wikimedia Commons/CC BY 2.0)
Because they already had access to the results of those methods, DNR researchers set out to find the best ways to model them so that trends and transition periods could be observed.
“We identified a candidate set of models that included time trend and other predictor variables such as body length, % lipid content, season caught (Spring–Summer or Fall–Winter), location caught (northern, central, or southern sections of Lake Michigan) and condition (a ratio of body weight to body length where K = 100 (body weight in grams/length in cm3)),” scientists write in the study. “Body weight was not available for all individuals, so we first fit models without condition as a predictor using the full datasets. We then used a smaller dataset without missing values for condition to compare the best-fitting models from the first step with additional models that included condition as a predictor.”
Since many of the individual fish’s genders had not been determined, it wasn’t included as a factor in the models. Researchers then used a measurement of model quality to assess each one’s value and chose the one that performed best. This best-fit model was then used alongside other models that had interactions involving its main effects.
In all, there were 765 chinook salmon included in the dataset. There were 393 cohos. These were collected over 29 and 22 years, respectively, from 36 different locations around the lake, including tributaries, offshore locations and other areas.
“The intersection of the two trends was 1984 for coho salmon and 1985 for chinook. Our data demonstrates a dramatic decline in PCB concentrations before the mid-1980s of −16.7% and −23.9% per year for chinook and coho, respectively, likely reflecting implementation of restrictions on PCBs,” study authors write. But the declines slowed down after that. “For the period between the mid-1980s to 2010, PCB concentrations declined at a rate of −4.0% per year and −2.6 per year for chinook and coho, respectively.”
The scientists say that the temporal differences in the PCB concentration declines between the two salmon types could be owed to differences in characteristics between their species. For full results of the investigation, including more on its methods and results, check out the entire study in the Journal of Great Lakes Research.


Pingback: FishSens Magazine | PCB Levels Continue To Drop In Lake Michigan - FishSens Magazine